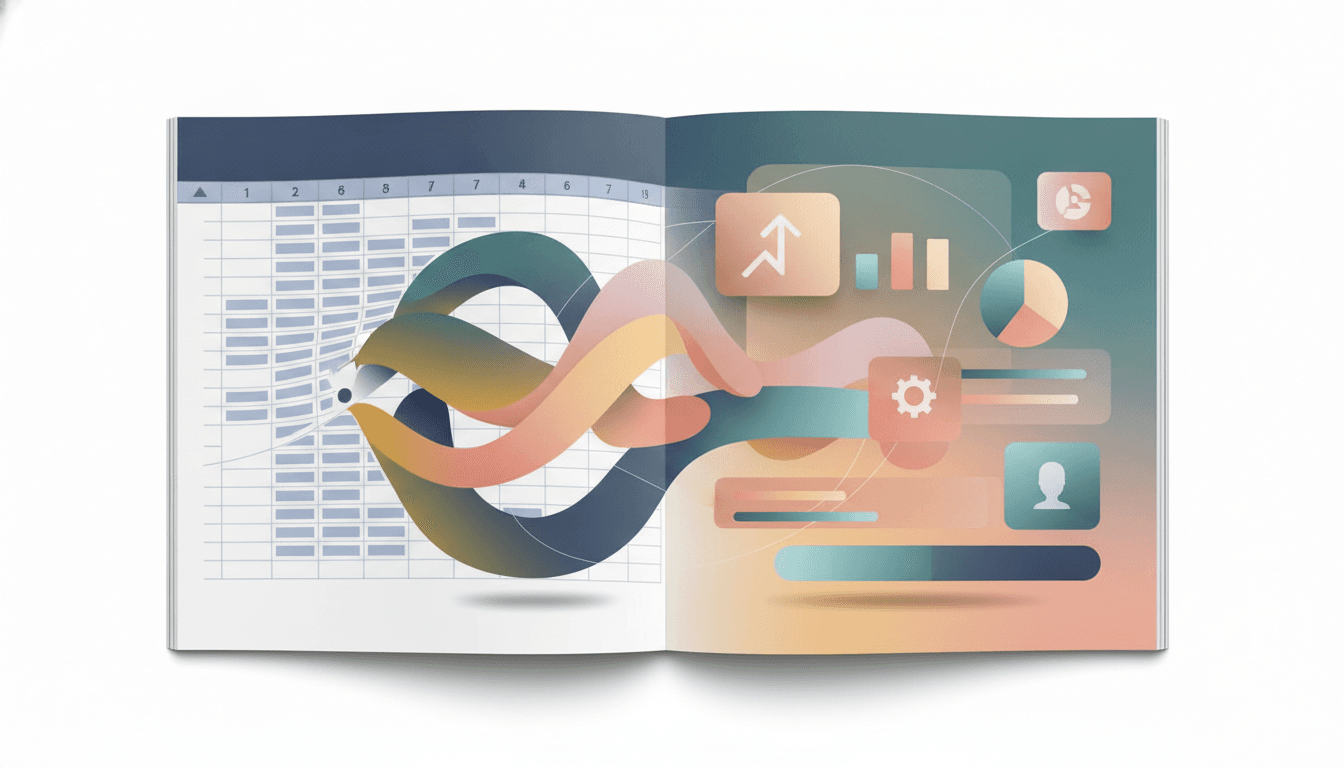
A New Way to See Your Spreadsheet Data
On 13 August 2026, Google introduced Sheets canvas, a feature built with Gemini that turns Google Sheets spreadsheets into custom, interactive "mini-apps". According to Eric Birnbaum, Director of Product Management for Google Sheets, the feature works as "a dynamic, read-write layer that sits directly on top of your spreadsheet data". In plain terms, you describe what you want in ordinary language and Gemini builds a visual version of your data for you. For small teams that live inside spreadsheets but lack the time or budget for custom software, this is a genuinely handy addition to the day-to-day toolkit.
What You Need
- A Google Sheets spreadsheet with your data in it.
- An eligible subscription. Sheets canvas is available globally in English to Google AI Pro and Ultra subscribers.
- Alternatively, a Google Workspace Business or Enterprise Standard or Plus plan, or a Google AI Pro for Education add-on, as it rolls out to those tiers.
- A clear idea of what you want to build — a tracker, a dashboard, or a planner.
Step-by-Step: Building Your First Canvas
- Open your spreadsheet. Start with a sheet that already contains the data you want to work with.
- Open the Ask Gemini side panel. Click the Gemini icon in Google Sheets.
- Select "Create canvas". Choose the Create canvas option in the side panel to begin.
- Write a natural language prompt. Describe what you want, for example "create a visual study tracker". Gemini builds it for you — no formulas or programming required.
- Refine it. Keep prompting Gemini to adjust layout, design and functionality until it fits your needs.
- Share it. Because the canvas lives as a tab in Google Sheets, you can share it with anyone, just like a regular sheet.
A Real Example: Tracking a Project Deadline
Say your team keeps a list of client assignments with columns for task, owner, status and due date. Open the Gemini side panel, select Create canvas, and type: "Create a visual study tracker showing progress, upcoming deadlines and the week ahead." Google's own example describes turning a list of assignments into an interactive study aid where you can "track progress, set reminders, and visualize the week ahead so you never miss a deadline". Because updates sync in both directions in real time, when a colleague marks a task complete in the sheet, the canvas updates too — and vice versa. Google also shows a wedding-planning example where guest RSVP data becomes a drag-and-drop seating chart, and a fantasy football dashboard that compares player stats side by side. The same pattern applies to any team dataset.
Tips for Getting More From Sheets Canvas
- Start with clean, well-labelled columns — clearer data produces clearer canvases.
- Be specific in your prompt about what you want to see and compare.
- Iterate. Treat the first result as a draft and keep prompting to refine it.
- Use the two-way sync to keep one source of truth rather than duplicating data.
Final Thoughts
Brain.mt can help you using AI for your business, whether that means setting up tools like Sheets canvas or building smarter workflows around your data. Contact me for more information. I also offer dedicated workshops and training about this subject, so your team can get hands-on and confident with these tools quickly.